
2024 – Q3 Market Update
Dear Clients and Friends,
Happy Summer! I cannot believe we are more than halfway through 2024. I think especially with two young kids, the saying “The days are long, but the years are short” is in full effect. Occasionally, I take a step back to slow down and realize how much has happened over the past 6 months. My babies are growing up!
When I sit down to write these market updates, I always look back at the previous ones to see what we discussed, where were the markets, and what were we focusing on at the time. When I looked back to the 2023 Mid-Year Economic & Market Update, it was eerily similar to what has been happening with the markets in 2024. Technology was leading the market, more specifically the “Magnificent 7.” This year is similar with the MAG 7 leading the charge yet again (AAPL, AMZN, GOOG, META, MSFT, NVDA, TSLA). Through July 9th, the MAG 7 were collectively up 41%. The S&P 500 was +18.61%. But, if you look at the S&P 500 return and exclude the MAG 7, the return drops significantly to 5%. Therefore, the share of the S&P 500 returns the MAG 7 make up is 65%!1
Historically, a good first half of the year bodes well for a strong second half. As previously mentioned, Tech stocks have dominated YTD and historically that looks like it can continue for the second half, and the markets in general.
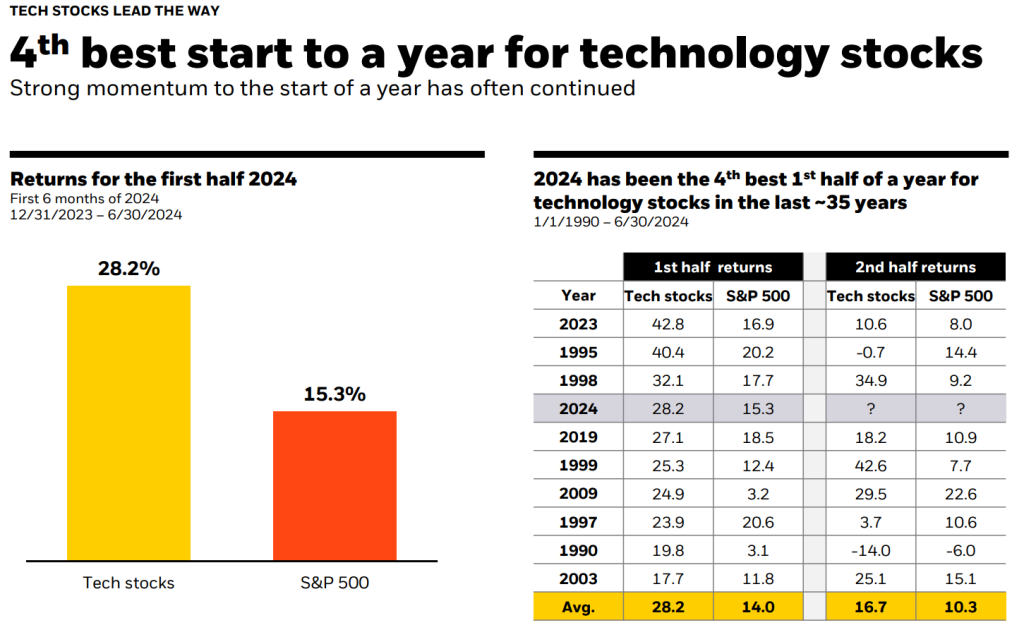
This chart above1 does not mean volatility will not be present, especially during an election year. (More on this later….). But, just over the past few weeks of July, we have seen a Tech reversal and small cap value rally. This is closing the gap between a broadly diversified portfolio and just looking at the S&P 500. Because our client portfolios tend to have a small cap and value bias (or tilt), this is adding to performance and helping close the gap mentioned. But if you’re thinking “why don’t we just invest in an index that tracks the S&P 500?” You are not alone…
We have been in a 15-Year period of US and Large Company outperformance (vs. International and Small Companies respectively) and a Growth vs. Value company outperformance. This has favored a Large Tech overweight which is why some are asking, why don’t we just double down on our large tech exposure? To illustrate why, we wanted to compare the S&P 500 performance to a 100% growth / 0% fixed income passive proxy (specifics in the disclosures); something that would mimic how we would invest a 100% growth account with broad diversification going back to January 1st, 2000.
Winning Even When it Doesn’t Feel Like it3 –
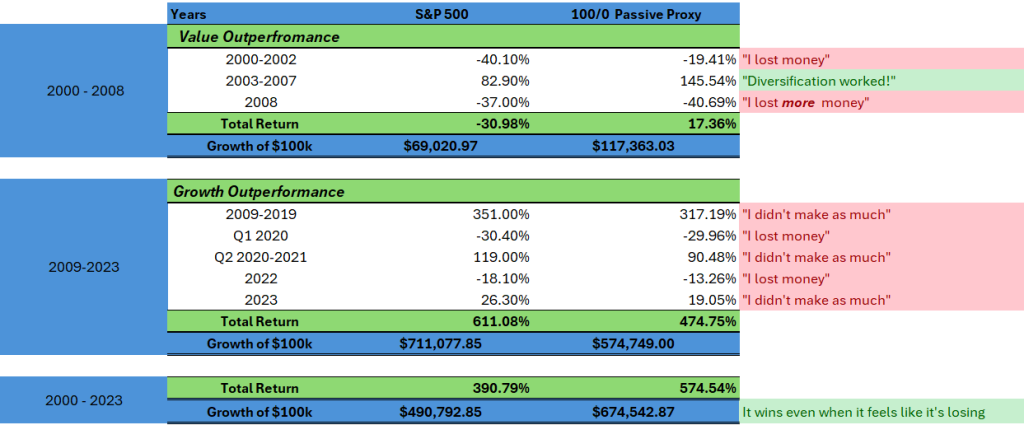
Value and International outperformed from 2000 – 2008, resulting in a total return of 17.36% for the Passive Proxy compared to (-30.98%) for the S&P 500. The S&P 500 took its turn outperforming during 2009 – 2023 with a total return of 611% vs. 475% for the Passive Proxy. But, looking over a 23-year period, the total return of the S&P was 390% vs. 575% for the broadly diversified portfolio. When you are in a period of outperformance from one area of the market, it is hard to not want to abandon a long-term view and “recency bias” tends to creep in. Trees don’t grow to the sky; the market will eventually remind us of this.
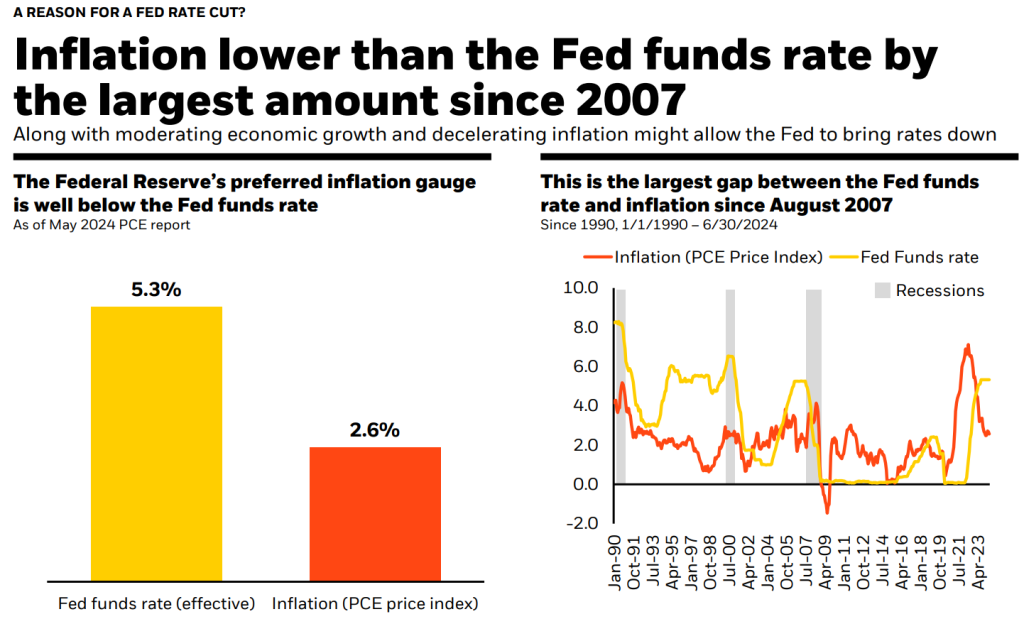
Inflation has come down and is starting to get closer to the FED Reserve target of 2%. We are on the right track, which is why you are hearing more about the FED cutting rates 1 or 2 times before year end. What the chart below2 suggests is a current disconnect between the FED funds rates and current inflation. If you look at previous periods of time, where the Fed funds rate is high relative to inflation for a prolonged period, this seems to have pushed us into a recession. This is historically not good for the economy, and we expect them to be seeing the same data we are, which in our opinion would get them to act soon. Rates coming down should bode well for growth stocks and real estate, but will also have an impact on cash rates in money markets, CD’s etc.
If you would like to discuss your long-term financial plan in greater detail or would value a review of your current investments, please contact our office to schedule some time with one of our Wealth Advisors. If you are not currently a client and value a second opinion, we are here to help. Now is a better time than ever to look at your current investments and financial plan to make sure they are properly positioned for the unexpected.
Regards,
Jerrod Ferguson, CFP®
Vice President
Disclosures: The views expressed in this commentary are subject to change based on market and other conditions. These documents may contain certain statements that may be deemed forward‐looking statements. Please note that any such statements are not guarantees of any future performance and actual results or developments may differ materially from those projected. Any projections, market outlooks, or estimates are based upon certain assumptions and should not be construed as indicative of actual events that will occur. Past performance does not guarantee future results. The information provided is for educational and illustrative purposes only and does not constitute investment advice and it should not be relied on as such. It should not be considered a solicitation to buy or an offer to sell a security. It does not take into account any investor’s particular investment objectives, strategies, tax status or investment horizon. You should consult your attorney or tax advisor. All information has been obtained from sources believed to be reliable, but its accuracy is not guaranteed. There is no representation or warranty as to the current accuracy, reliability, or completeness of, nor liability for, decisions based on such information, and it should not be relied on as such. Vance Wealth, Inc. (“Vance Wealth”) is a registered investment advisor. Advisory services are only offered to clients or prospective clients where Vance Wealth and its representatives are properly licensed or exempt from licensure. The S&P 500 is an unmanaged index of 500 widely held stocks. Investors cannot invest directly in an index.
Source: Morningstar as of 12/31/23. *Performance is from 01/01/2000 to 12/31/23 for the S&P 500 Index. The S&P 500 is an unmanaged index of 500 widely held stocks that’s generally considered representative of the U.S. stock market.
Source3: Dimensional Fund Advisors. 100-0 Passive Proxy Performance from Jan 2000- Dec 2002 is represented by 21% Dimensional US Large Cap Growth Index, 21% Dimensional US Large Cap Value Index, 7.90% Dow Jones U.S. Mid-Cap Growth Total Stock Market Index, 9.60% Dow Jones U.S. Mid-Cap Value Total Stock Market Index, 3.70% Dimensional US Small Cap Growth Index, 6.80% Dimensional US Small Cap Value Index, 6.40% Dimensional International Large Cap Growth Index, 9.60% Dimensional International Large Value Index, 5% Dimensional International Small Cap Index, and 9% Dimensional Emerging Markets Core Equity Index. 100-0 Passive Proxy Performance from Jan 2003- Dec 2023 is represented by 21% Dimensional US Large Cap Growth Index, 21% Dimensional US Large Cap Value Index, 7.90% CRSP US Mid Cap Growth Index, 9.60% CRSP US Mid Cap Value Index, 3.70% Dimensional US Small Cap Growth Index, 6.80% Dimensional US Small Cap Value Index, 6.40% Dimensional International Large Cap Growth Index, 9.60% Dimensional International Large Value Index, 5% Dimensional International Small Cap Index, and 9% Dimensional Emerging Markets Core Equity Index. The construction of this chart uses cumulative percentage returns over each period that is specified in the chart. The chart also assumes annually rebalancing for the 100/0 Passive Proxy portfolio. The 100/0 Passive Proxy portfolio is made up of indices. Investors cannot invest directly in an index. Total return numbers represent monthly compounding returns for each period.
Sources:
- BlackRock – Student of the Market, July 2024
- BlackRock – Student of the Market, July 2024
- Dimensional Funds – Dimensional Quick Take, from “The Market and US Presidential Elections”