
Tariffs, Trends, and Timing: Understanding the Current Market Landscape
The volatility in the markets over the past few days has brought back bad memories from 2020 and the massive swings in the markets. The White House’s latest tariff announcements mark a sharp escalation in trade protectionism, with a new 10% baseline tariff on most U.S. imports and additional reciprocal tariffs pushing the weighted average to an estimated 20-25% — significantly higher than market expectations. While negotiations could bring these rates down, tariffs at elevated levels introduce new risks to growth, inflation, and corporate earnings.
The U.S. administration has embarked on a historic path to reshape global trade, aiming to bring jobs and revenue to the U.S. Tariffs and non-tariff measures have a direct and, in most cases, immediate impact on costs, making imported goods and raw materials more expensive. The result? Higher inflation in the near term. If policy uncertainty lingers, inflation pressures could persist as shifting tariffs and trade barriers drive up business costs, prompting precautionary price hikes. But today’s environment isn’t the same as it was five years ago. The Fed has room to be flexible and adapt to current economic conditions.
Before the election, we mentioned it didn’t matter historically who won the White House. Our issue was with both sides and how we seem to have a spending problem. No one has wanted to address this since President George W. Bush took office. He added about $4 trillion to the U.S. national debt when military spending increased to record levels due to the September 11th attacks. This was followed up by President Barack Obama who added the most debt in terms of dollar amount1. Both Trump in his first term and Biden most recently added their fair share. In my mind, President Trump is causing short-term pain to set our country up for longer-term gain. Whether one agrees with his approach is another question. The reality is, the market and economy could not continue to keep running that hot. U.S. markets have been overvalued for a while.
Even with the recent losses in the S&P 500, the market is still +81.49% over the past five years (4/9/2020 – 4/7/2025). This includes the market correction of (17.5%) +/- over the past 6 ½ weeks (since Feb. 19th) and the majority happened just over the past week and a half with the S&P 500 losing (12.7%). Real wealth has been created over the past five years, but it hasn’t been easy.
When times are tough, we want to limit our losses. When things are going well, we wish we had invested more or were more aggressive in our accounts. We all fear missing out. But when you’re investing, giving in to fear is often a losing strategy. More often than not, investors with this mindset tend to buy high and sell low as they invest more in a rising market and pull money out in a falling market. Investors who have followed their emotions, joining the crowd of other emotional investors, have historically regretted it. Periods that followed investors cashing out of the market have provided above-average returns, while periods that followed investors adding to the market have provided below-average returns2.
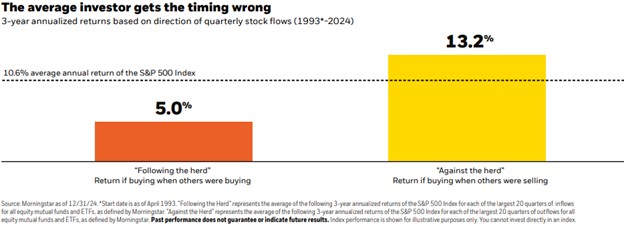
“Be fearful when others are greedy, and greedy when others are fearful” – Warren Buffet.
There’s always a reason to sell stocks. This hasn’t stopped the long-term trajectory of stocks gaining value with obvious points of volatility along the way.3
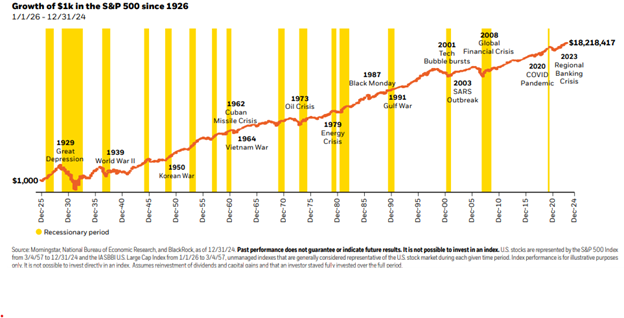
Do any of those major events or periods of time bring back any similar feelings? Does it bring back similar fear or uncertainty about the future? Is “this time really different?” We get it. Investing can be an emotional experience. With $1,000 invested in December 1925, it grew to $18,218,417 over a 99-year period. It wasn’t without historic events and headlines.
The way market volatility and subsequent recoveries work, it’s impossible to predict or time the market. The graph below shows how a hypothetical $100,000 investment in stocks would have been affected by missing the market’s top-performing days over the 20-year period from January, 2005 to December 31, 2024.
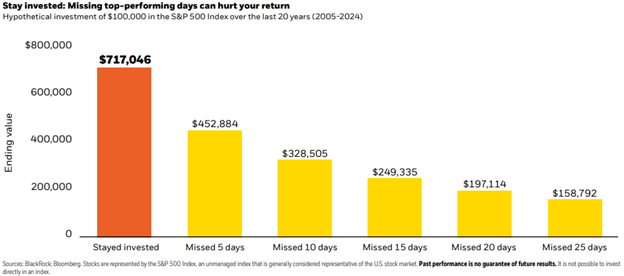
An individual who remained invested for the entire time period would have accumulated $717,046, while an investor who missed just five of the top-performing days during that period would have accumulated only $452,884.4 That’s a difference of $264,000…That is real money.
Diversification is Helping
U.S. market’s have dominated since 2010, but they essentially went sideways from 2000 – 2010. This is why it was dubbed “The Lost Decade.” As the U.S. markets continued its outperformance last year, we rebalanced client accounts to trim from U.S. stocks; mostly large growth given its strong 2-year performance. We added to other areas of the market that have underperformed or were underweight vs. their target allocation. This had us trimming U.S. large growth in favor of international stocks and fixed income (bonds). Through Friday, bonds were positive somewhere between 2-5% and International just turned slightly negative but outperforming U.S. markets, nonetheless.
We Planned for This
We are a planning-focused firm for market environments like this. This is why we focus so much on our clients’ financial plans; short and long-term goals, and ensure we understand their future cash flow needs. This allows us to plan for the “unexpected,” because it is not a matter of IF, it is a matter of WHEN the markets will lose value. Markets are efficient over time. I’ve said this before, there is SO MUCH to be excited about that is on the horizon in terms of innovation and growth opportunities. The fear and scarcity mentality can be debilitating; in life and investing. Vance Wealth prides ourselves on an abundance mindset for uncertain times similar to what we are in today. For clients that are retired and spending from accounts, we are selling from fixed income investments that have held up well to send monthly income. You’ve likely heard us say we like to target “7-years worth of spending needs in fixed income investments.” Am I confident the markets will be higher in 7 months? No. But I am confident they will be higher in 7 years.
Focus on what you can control; spend time with the ones that matter most and spend your time doing the things you love. We will continue to monitor the markets and your accounts and take any action that is needed. If you have questions around your specific investments or financial plan, please contact our office to speak with your advisor.
Regards,
Jerrod Ferguson, CFP®
Vice President
Resources:
- Investopedia: “U.S. Debt by President: Dollar and Percentage”
- BlackRock: Investing with amotions can be costly
- BlackRock: There’s always a reason to sell stocks
- BlackRock: Strategies for volatile markets
Disclosures: The information provided is for educational and informational purposes only and does not constitute investment advice and it should not be relied on as such. It should not be considered a solicitation to buy or an offer to sell a security. It does not take into account any investor’s particular investment objectives, strategies, tax status or investment horizon. You should consult your attorney or tax advisor. The views expressed in this commentary are subject to change based on market and other conditions. These documents may contain certain statements that may be deemed forward‐looking statements. Please note that any such statements are not guarantees of any future performance and actual results or developments may differ materially from those projected. Any projections, market outlooks, or estimates are based upon certain assumptions and should not be construed as indicative of actual events that will occur. The S&P 500 is an unmanaged index of 500 widely held stocks. Investors cannot invest directly in an index.